Virtual Touch™ IQ
This web-based training provides ultrasound technologists and physicians with relevant information to enhance and improve their clinical knowledge of Virtual Touch™IQ also referred to as VTIQ on the ACUSON S2000™ HELX ultrasound and ACUSON S3000™ HELX ultrasound systems. This module explains the technology and the clinical background and identifies what is required to successfully utilize and optimize VTIQ on the ACUSON S2000 HELX and the ACUSON S3000 HELX ultrasound systems.
Upon completion of this course, the learner should be able to:
- Describe VTIQ technology
- Perform scanning technique
- Identify the VTIQ workflowIdentify the measurement and reporting capabilities.
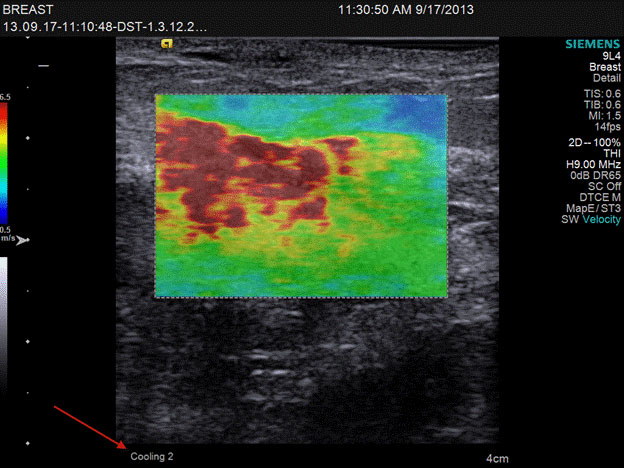
Virtual Touch™ IQ This web-based training provides ultrasound technologists and physicians with relevant information to enhance and improve their clinical knowledge of Virtual Touch™IQ also referred to as VTIQ on the ACUSON S2000™ HELX ultrasound and ACUSON S3000™ HELX ultrasound systems. This module explains the technology and the clinical background and identifies what is required to successfully utilize and optimize VTIQ on the ACUSON S2000 HELX and the ACUSON S3000 HELX ultrasound systems. Course Objectives Describe VTIQ technology Identify the measurement and reporting capabilities Identify the VTIQ workflow Perform scanning technique Upon completion of this course, you should be able to: Image Mode Characteristics Clinical Background Historically, palpation has been widely used as a method to assess the stiffness and elasticity of tissue Changes in tissue stiffness are known to generally correlate with pathological changes Fingertips provide the pressure, sense and interpretation Detect size, location, mobility in an area of interest Palpation has limitations: Deeper depths, smaller lesion sizes Subtle differences in tissue composition Thus it can be difficult to make a diagnosis Now, we use ultrasound to interrogate tissue and provide information about tissue stiffness Strain Imaging: Basic Concepts Strain imaging is an ultrasound imaging technique which provides information about the mechanical properties (stiffness) of tissue Stiffness is relative to the surrounding tissue Basic process is simple: Deform tissue (in a region of interest) with a mechanical force, or stress Compare before and after deformation images to show the tissue displacement Calculate the strain which is the variation in displacement Display the result as an elastogram Strain imaging can help clinicians “see” the relative stiffness of a particular area that they may not be able to feel Virtual Touch IQ (VTIQ): Siemens Applications and Technologies. Strain Imaging Technology Methods in Elasticity Visualization/ Quantification VTIQ Technology Each “Phase” is focused at a specific depth location for maximum uniformity and excitation response Instead of pushing multiple times on the same location with short pulse repetition interval as used on Virtual Touch™ Quantification, Virtual Touch IQ uses up to two phases of acquisitions One is used if ROI height is 1.5 cm or less, and two are used in larger ROI sizes Each phase is walked across the transducer aperture, alternating the spatial locations in the field of view VTIQ Display Maps Transducer: 9L4 Exam Presets: Breast, Thyroid Maximum Depth: 4.0 cm Maximum Velocity: 10 m/sec Shear Wave Caliper ROI size (not adjustable): 1.5 x 1.5 mm Shear Wave Velocity Image Adjustable Shear Wave Velocity Scale for Color Coded display Allows for stiffness visualization of Lesions in one image with Color Coded display and localized velocity measurements Existing Need for a Non-invasive, Readily Available Testing (Breast and Thyroid) Clinical Benefits of Virtual Touch IQ: Combination of Image and Quantification for higher diagnostic confidence Newest version of Acoustic Radiation Force Impulse technology High spatial resolution for visualization and quantification of heterogeneity in focal lesions Higher reproducibility and repeatability than conventional elastography High specificity may potentially reduce the number of unnecessary biopsies in breast and thyroid lesions Hard Lesions Identify and measure Maximum Vs in the Velocity map Use Quality map to verify Vsis valid in the region of Maximum Vs Avoid Vsmeasurements in regions of low quality Adjust Max Velocity scale if the measured Vsexceeds default setting Black regions (see through to B-mode) indicate Vsnot measurable Cysts Low viscosity cysts should appear black (see through to B-mode) High viscosity cysts with shear waves present appear blue Displacements may be high in cystic structures relative to tissue Soft Lesions Low Vs– consistent with surrounding fat and fibroglandulartissue Use Quality map to confirm normal displacements and high quality Mild compression suggested for ‘hard’ benign lesions (e.g. fat necrosis) Identify the Maximum Vs in the Velocity Mode Use the Quality Mode to verify Vs is valid in region of Max Vs Avoid Vs measurements in regions of Low Quality Adjust the Vs Scale if the measured Vs exceeds the max scale (High will be noted in the Vs measurement) then re-measure Black Regions (See through to B mode) indicate that Vs in not measurable (i.e. low viscosity cysts) High viscosity cysts with Shear Waves present appear Blue Mild compression (greater than Elastography) is suggested VTIQ Imaging Screen 1 -Virtual Touch IQ region of interest 2 -Color bar 3 -Measured results for shear wave velocity 4 -Measurement counter 5 -Measurement marker with unique identifier. 6 -Virtual Touch IQ measurement labels 7 -Virtual Touch IQ measurement tool 8 -Cooling Timer VTIQ Workflow Activate Virtual Touch IQ from the Virtual Touch tab menu Position and adjust ROI. press NEXT to activate either the positioning or sizing function for the ROI. Roll the trackball to reposition or resize the ROI. Select Update to begin acquisition. Progress bar counts down time until probe is cooled and ready to acquire again Rotate the LCD control A to cycle through the different display settingmaps (Velocity, Quality, Time and Displacement) To activate a dual display format, double-click UPDATE. The left image displays the ROI. The right image is blank. Click update again to display dual image acquire a shear wave image in dual display form. 2mm x 2mm ROI Multiple real-time meaurement cursors available within single image Quantitative (Vs in m/sec) Adjustable Shear Velocity Scale Multiple Display Maps (Velocity, Quality, Time, Displacement) Report Package Available Shear Wave Velocity caliper Multiple calipers can be used Only enabled in SW Velocity map All other measurement tools accessible When maximum velocity is exceeded in measurements, Vs=High appears When minimum velocity is below the threshold, Vs=Low appears To adjust the range of velocities displayed press the LED control B to display either [Max Velocity] or [Min Velocity] on the LED panel. To change the maximum velocity displayed, rotate [Max Velocity]. To change the minimum velocity displayed, rotate [Min Velocity]. Stress Can Be Created in Two Different Ways: Manual Acoustic You should now be able to: Describe VTIQ technology Perform scanning technique Identify the VTIQ workflow Identify the measurement and reporting capabilities Display Maps in virtual Touch IQ*: SW Velocity TTtTime to Peak Inverse Slope Velocity is estimated “See through to B-mode” when signal is poor Vsscale 0-10 m/sec SW Displacement Displacement Magnitude High in soft tissue and fluid Low in stiff tissue Scale is “High” to “Low” SW Quality Displacement Magnitude Signal Noise Level Both are analyzed Low disp, noisy = Low Q High disp, smooth = High Q Scale is “High” to “Low” SW Travel Time More sensitive to rapid changes in shear wave speen than the SW velocity display, for enhanced boundary definition Scale is “Fast” to “Slow” BI- RADS 5 Lesion - Intraductal Carcinoma at biopsy Lesion is highly attenuating Shadowing in B mode ultrasound High shear wave velocity ‘ring’ in VTIQ Poor shear wave quality in center SW Quality display differentiates where the SW velocity estimate is accurate and where the SW velocity estimate is poor, aiding in image interpretation Intraductal Carcinoma at biopsy Lesion is less attenuating No shadowing in B mode ultrasound Uniform high SW Velocity in lesion SW Quality display indicates good SW velocity estimate throughout lesion Biopsy Proven Benign Case Example Lipoma (Fat Tumor) Thyroid Adenoma (Degenerating) or Collid Cyst Arrow indicates a suspicious focal area (Note: High spatial resolution in detection of small lesions)
- Virtual Touch™ IQ